
By using Big Data for Safety, it becomes possible to give more precise advice on what is nót safe and on what ís safe.
Use big data for safety to discover:
- Which factors pose the largest challenges to safety (prioritisation)
- And under which circumstances exactly (specification)
This approach makes safety interventions and advice more attrative to implement because it allows for more specific safety interventions that do not unnecessarily impede production and innovation. It is for example no longer necessary to advice that a certain (infrastructure) element is no longer used at all, but instead it is possible to say under which circumstances it should not be used, and under which circumstances it can be used safely.
Which data step is your safety department on and where do you want to go?
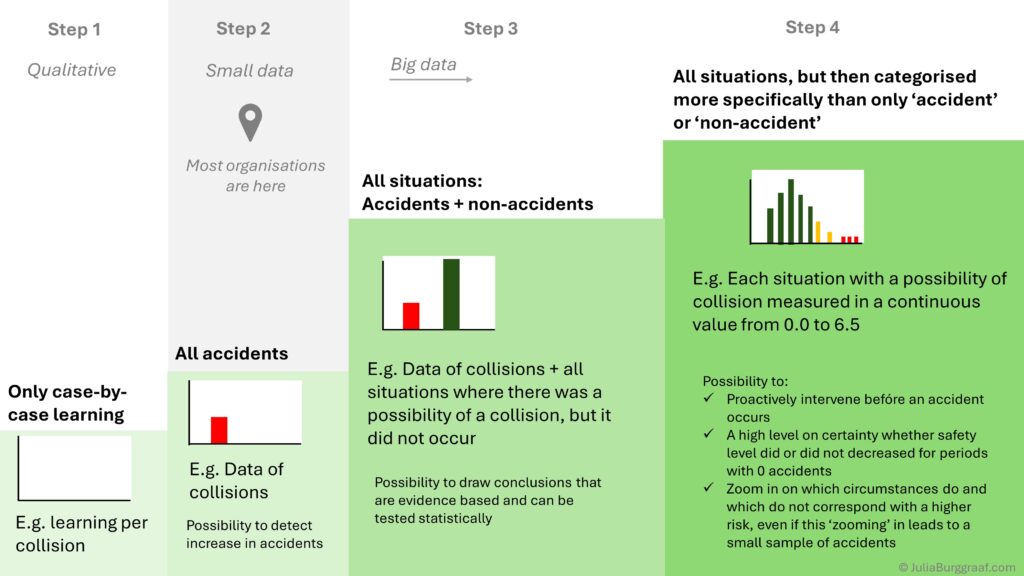
Step 1: The organisation analyses individual accidents when they occur and tries to learn from each accident seperately.
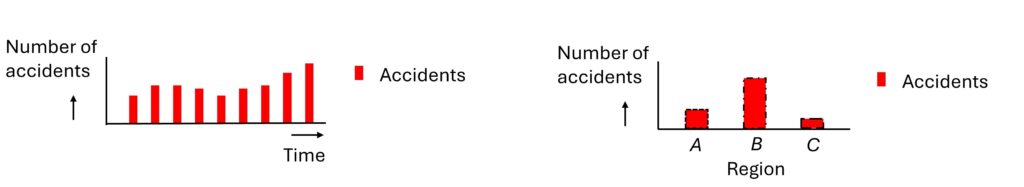
Step 2: In addition to learning from each accident seperately, the organisation also combines the data of all accidents. This gives the opportunity to detect increases in the number of accidents over time.
However, this type of data gives no indication as to why there is an increase in the number of accidents. Even if there are more accidents on a specific location, it is impossible to conclude whether the probability of an accident is higher in that location or whether there is simply more activity in that location.
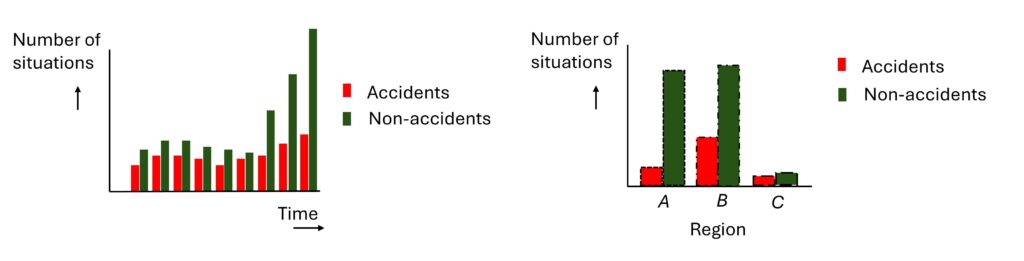
Step 3: The organisation records data for each accident ánd for each ‘non-accident’. A ‘non-accident’ is the situation where an accident could have occured, but did not. This is similar to ‘exposure’.
For example in rail, when a train passes a red aspect without authority, this is called a Signal Passed at Danger-event (SPAD). The SPAD is the accident and the non-accident is the approach of a train to a red aspect (both the train and the red aspect need to present in order for a SPAD to occur). In the case of an accident with a railbound crane used for maintenance on rail infrastructure, the non-accident can be the employment of a railbound crane for maintenance on rail infrastructure.
If the number of accidents with railbound cranes increases, it might seem like a logical question to ask: does this also correspons with an increase in the number of times that railbound cranes were employed? However, many organisations only have data on accidents. In the past it was simply not practically feasible to obtain data on all the situations where nothing went wrong, because this usually encompasses vast amounts of data points, like the example of all red aspect approaches of all trains everyday.
Once data is gathered for all situations, then it is possible to analyse whether increases are caused by a change in exposure (‘more activity’) or in probability (‘higher chance of things going wrong’). It is then also possible to analyse which factors correspond with a higher probability of an accident. It is now possible to perform statistical analysis, so one can conclude whether a specific region indeed has a higher probability of an accident or any other (human) factor like a specific infrastruction location, the absence of a specific safety intervention or the moment in one’s shift.
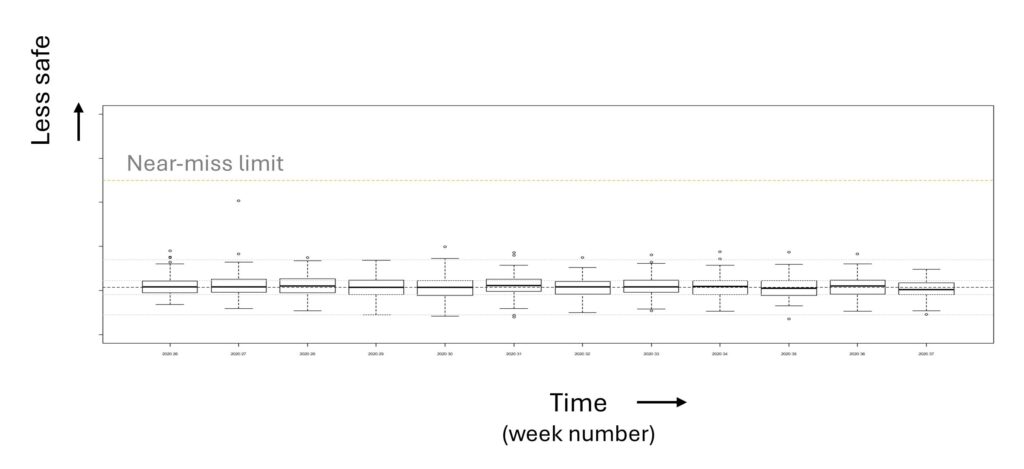
Step 4: The organisation records data for each accident ánd for each ‘non-accident’ like in step 3, but instead of measuring these binairy (‘accident’ or ‘non-accident’), it is measured in more categories. The smallest upgrade is to go to 3 categories like ‘accident’, ‘near miss’ and ‘non-accident’. The highest level is to measure the situation in a continuous numerical value. For example each red aspect approach can be measured in terms of maximum Deceleration to SPAD (mDtSPAD) in a required deceleration value (m/s).
Having such a measure makes it possible to see whether there are any changes in level of safety, even when there are no accidents. This can be especially useful when testing a new innovation with a trial period of 6 months. Below is a real example with weekly monitoring where one can see that there are no near-misses and also that the boxplots stay at the same level throughout time.
Measuring in many levels also makes it also possible to gain more insight into the type of differences between factors since one can look at the differences in the shape of the distribution (see image below).

How can I help?
Please contact me if you are looking for (remote) support in creating a vision on using big data for safety and/or brainpower to move your department one or even two steps up in data use.
About Julia Burggraaf, PhD
I like to describe myself as a ‘psychologists who can write code’. During my bachelor in psychology and later during my master, I developed a love for both human behavior ánd data. I enjoy speaking both languages, the language of the human factors specialists ánd of the data analysts, and translating between the two. This translation can be between data experts and safety experts or in answering a difficult question that requires complex and abstract safety/behavioral concepts to be translated into measurable data terminologie.
Publications
Data related papers including human factors
What Employees Do Today Because of Their Experience Yesterday: How Incidental Learning Influences Train Driver Behavior and Safety Margins (A Big Data Analysis)
https://doi.org/10.3390/safety7010002
What Employees Do Today Because of Their Experience Yesterday: Previous exposure to yellow:number aspects as a cause for SPAD incidents
https://doi.org/10.1016/j.jrtpm.2022.100332
How Cognitive Biases Influence the Data Verification of Safety Indicators: A Case Study in Rail
https://doi.org/10.3390/safety5040069
Non-data related human factors papers
Managing the Human Factor in the Incident Investigation Process
https://doi.org/10.2118/179207-MS
Dissertation
The identification of incidental learning as a cause of human error by exploring big data within railway safety
Or
https://doi.org/10.4233/uuid:c5b1a63b-3873-4b1b-b4ed-e12390d21d40
Work experience
External PhD at the Technical University of Delft and ProRail, the Dutch rail infrastructure manager. Research on the use of big data to investigate the human factors involved in trains running through a red aspect. Including other data and safety projects within ProRail.
Consultant, trainer and product manager at CGE Risk Management Solutions on their barrier-based software solutions and the risk models, including bowtieXP, IncidentXP, bowties and barrier-based incident analyses.
Human Factors consultant at Intergo.
Statistics teacher at the Univeristy of Leiden.
Main education
Master Cognitive Psychology at University of Leiden, the Netherlands